
Understanding Your Detailers Roadmap Website Dashboard
Your website is kind of like a shop window on a busy street corner. Except instead of foot traffic, it’s digital traffic. In other words, it’s not just sitting pretty online. It’s designed to pull in leads and help your business grow.
That’s where your website dashboard comes in. It’s your control center, and it shows you who’s visiting, how they’re interacting, and what’s actually turning into business. Every business owner should understand this because the more you know about your traffic and leads, the smarter business decisions you can make.
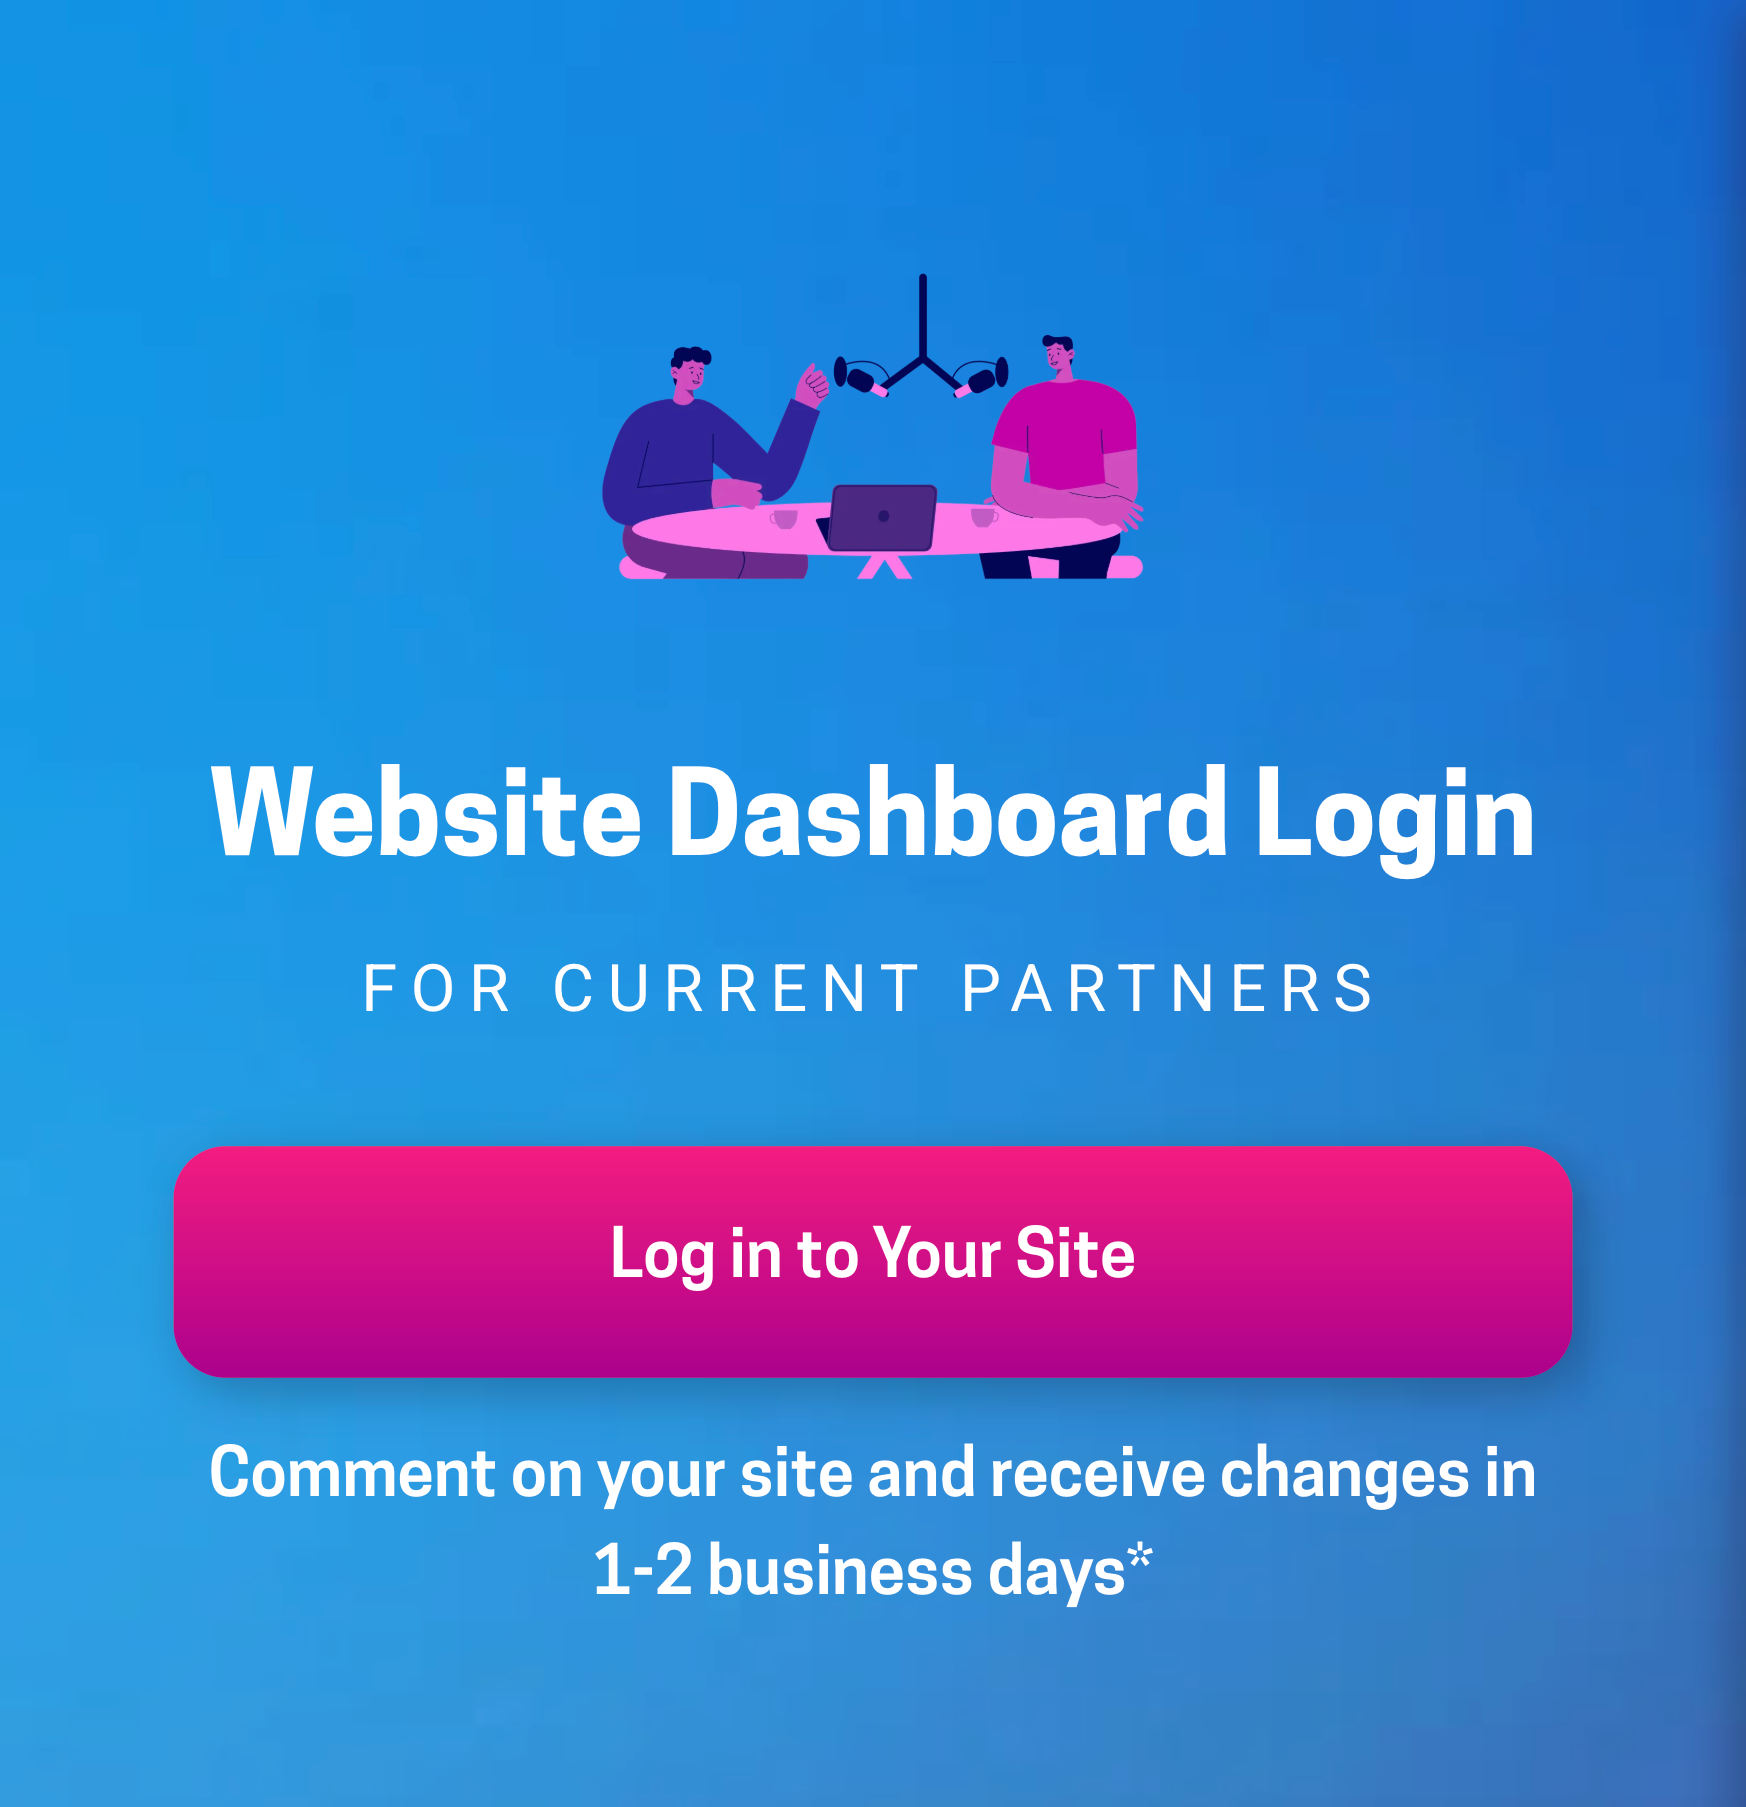
How to Log In
Getting into your dashboard is easy:
- Head to the Website Dashboard Login
- Enter your email and password.
- Boom—you’re in.
Pro tip: Bookmark the login page so you don’t have to dig for it later. Better yet, save your credentials in a password manager.
Try to check in at least once a week. It takes just a couple of minutes, and you’ll probably spot trends you’d miss if you only looked once in a while.
Understanding Analytics in Your Dashboard
a. Traffic (AKA Site Visits)
Traffic shows how many people are visiting your site. Simple, right?
For many businesses, we typically see 250-400 visitors per month. Keep in mind, this can vary depending on your local population, how long your site’s been live, and how Google views your authority. But here’s the key. It’s not just about numbers. A thousand random visitors don’t matter if none of them book a service. Quality over quantity every time.
That’s where a metric called bounce rate comes in. A bounce rate shows the percentage of people who showed up, then left the site without engaging with it.
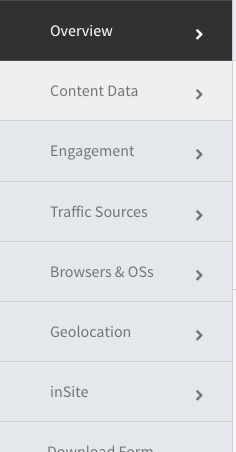
If you open up your full stats and look at the content data tab, you’ll see a breakdown of individual pages. You will be able to see how much time people are spending on different service pages, which can be a good indicator of useful information on the page and qualified leads (because they’re taking the time to learn about your services). For most pages, 30 seconds is common.
Additionally, you can look at the traffic sources tab to determine the individual sources of your visitors. Below is a defined description of some of the sources you may see listed:
- Direct: The system is unable to distinguish exactly where these visitors come from (potentially these are from organic sources, texted links, ads, email, etc.)
- Google/search: Provides a good indicator of SEO rank/organic search value
- Dash/internal: Shows which pages are pulling visitors from other pages
- Google Paid: Shows traffic from ads
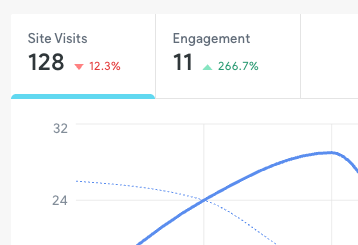
b. Engagement
Engagement shows when visitors actually
do something, like click your call button or fill out a form.
Here’s how to calculate your engagement rate:
Engagement ÷ Site Visits = %
Example: 18 engagements ÷ 271 visits = 6.64%.
For reference:
- Industry average: 1–3%
- Detailers Roadmap sites average: 3–9%
Engagement matters more than visits because it proves your website isn’t just being seen—it’s actually working. Something important to note is that if you have Customer Relationship Manager (CRM) software, like Urable, OrbisX, or Detail Bookie, we don’t have the ability to track customers once they leave your Detailers Roadmap site to book a service.
How to Use the Dashboard to Understand Trends
Engagement shows when visitors actually do something, like click your call button or fill out a form.
The best way to get value from your dashboard? Look at the last 30 days. Or, better yet, compare the last month to the same time last year. It’s like checking your car’s gauges. You’ll see the clearest snapshot of what’s happening:
Over time, watch how traffic and engagement move. You’ll start noticing:
- Busy seasons for your business
- The impact of a promotion, discount, or Facebook ad
- Areas where people may be dropping off (a clue that tweaks might be needed)
It really allows you to turn raw numbers into a story about your business. If you want more detailed data, we recommend setting up Google Analytics. Just give us the G- number in a website comment, and we can install it for you.
Insights Into Action
Here’s the truth: a website alone won’t grow your business. It’s a piece of a bigger marketing engine. Your dashboard is there to show you what’s working and where to double down.
Pair what you learn with:
- Google Business Profile updates (stay fresh)
- Local SEO (so more nearby drivers find you)
- Paid ads and social media (to drive new eyes to your site)
Your dashboard is the scoreboard. It tells you if your plays are working or if you need to adjust the game plan.
At the end of the day:
- Traffic brings people to your site
- Engagement turns those people into leads
- Understanding both helps you grow your business
So here’s your homework: log into your dashboard today. Take a few minutes to check your traffic and engagement. Even a quick glance can tell you a lot.
Remember—your website isn’t just an online business card. It’s a tool, and when you know how to read the numbers, you’re in the driver’s seat of your business’s growth.